RESEARCH ARCHIVE / UNIVERSITY OF NEVADA, RENO / 2010
Making data
understandable.
Visualization of Transect Data (VTD), an NSF EPSCoR undergraduate research project.
The question
How can researchers from different disciplines explore complex environmental data through a common, approachable visualization tool?
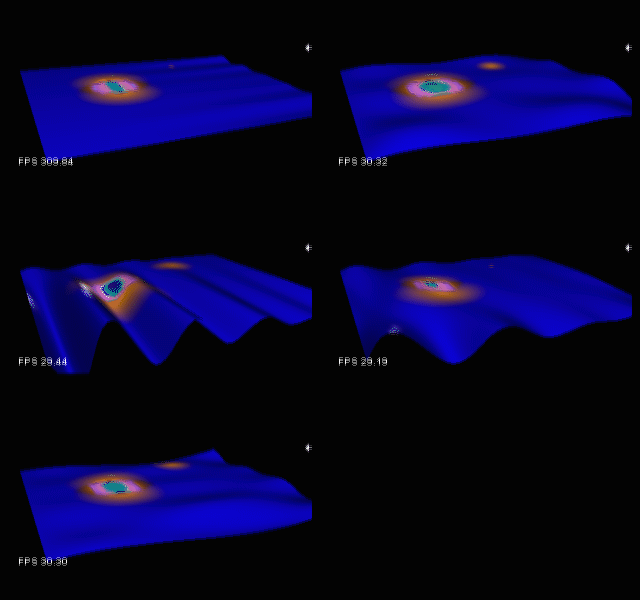
The proposal explored methods ranging from conventional 2D charts to animated 3D surfaces, making changes over time visible alongside spatial relationships.
The work
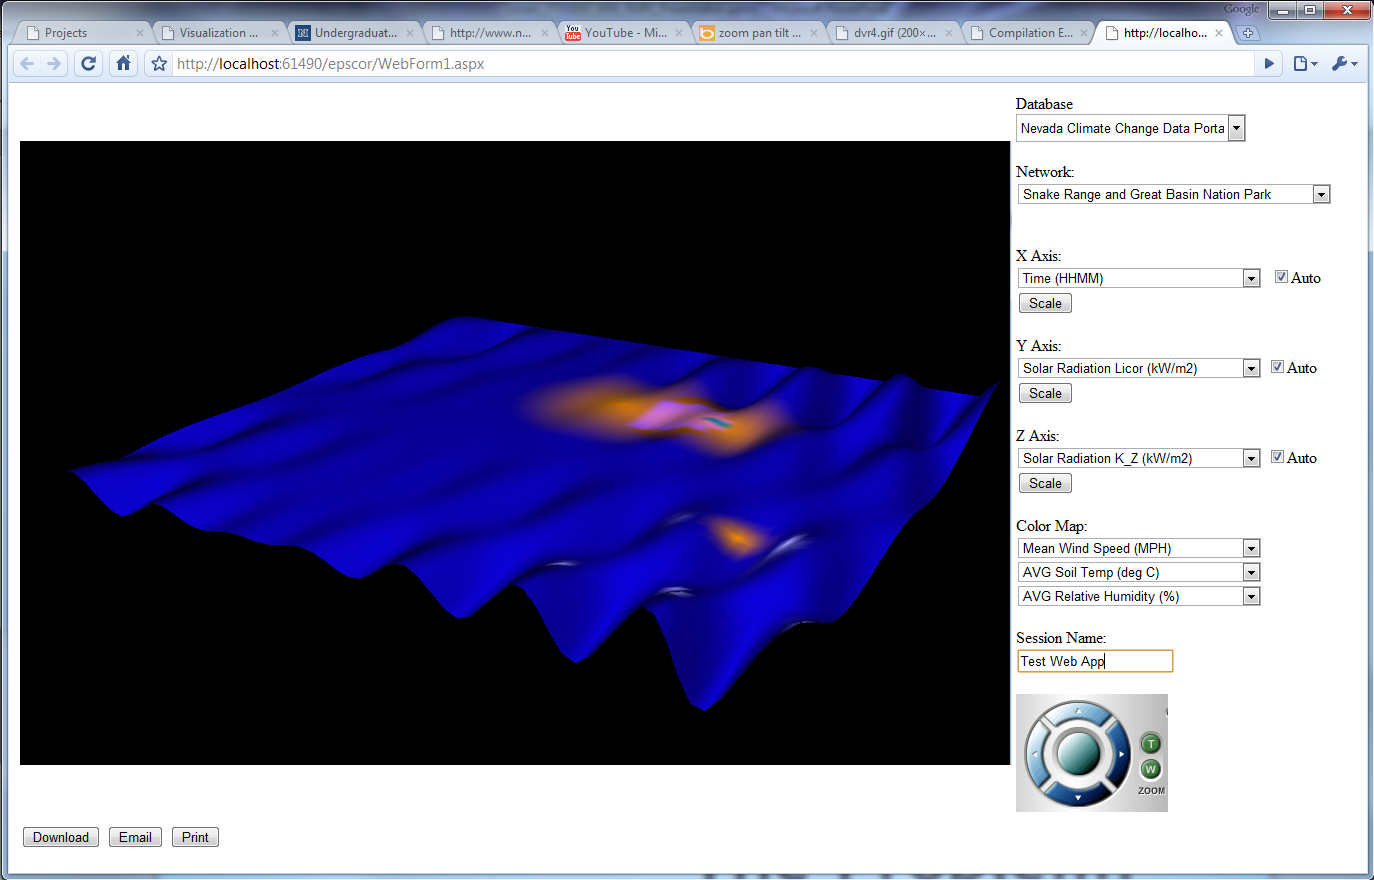
Joel’s proposal was endorsed by Dr. Sergiu Dascalu and Dr. Franco Biondi. An early visualization demo was rendered with a custom application built on ICE. The surviving development notes describe investigation of OpenDX, VTK, and the bridge between rendering code and a web interface.
This is a historical project summary. The surviving site describes the web application as under development; it is not presented here as a running service.
FROM THE ORIGINAL DESIGN
A visual workspace
for environmental data.
The original interface concept, preserved alongside the rendering demo.
Browse recovered material ↗